Mastering Missing Data: Four Effective Imputation Techniques
Written on
Chapter 1: Understanding Missing Data
If you have delved into data analysis or data science, you are likely aware that approximately 80% of the effort revolves around data collection and preparation, while only 20% is dedicated to actual data analysis and model development. This principle holds true even if you haven’t yet engaged in practical applications. A pivotal aspect of data preparation involves managing missing values.
In the realm of data analysis, encountering a dataset devoid of missing values is quite rare. If you do come across such an anomaly, it is likely because the data has been previously cleaned, or the dataset is small and straightforward, making it easier to identify and rectify missing entries. When dealing with larger datasets, dropping incomplete observations may not be feasible if every entry is significant. In such cases, employing methods for imputing missing values becomes essential.
Let’s envision a practical scenario. After executing your database queries, merging tables, and performing pivot operations, you end up with a final table ready for analysis. Yet, you cannot commence your analysis or model building until you address the missing data.
This article presents four techniques for imputing missing values, along with Python code examples. For demonstration purposes, we will utilize the insurance.csv dataset, which is readily available on Kaggle. If you wish to follow along, please download the dataset and use Google Colab.
# Import libraries:
import pandas as pd
import numpy as np
import random
# Import and load dataset:
df = pd.read_csv('/content/insurance.csv')
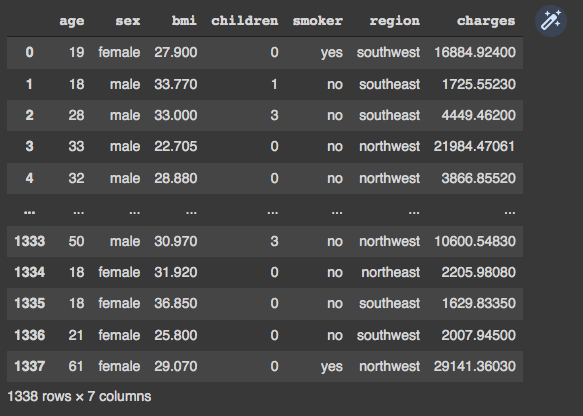
df

Upon initial visual inspection, it appears that our dataframe contains no missing values. We can confirm this by executing the following command:
# Check for NAN values in dataframe:
print(df.isnull().values.any(), df.isnull().sum().sum())
To proceed, we need to artificially introduce missing values into our dataframe. We will insert 10% of missing values while ensuring that no single row is entirely filled with NAN values. Keep in mind that our dataframe is structured as an algebraic matrix with i rows and j columns.
# Iterations with i (rows) and j (columns):
ij = [(row, col) for row in range(df.shape[0]) for col in range(df.shape[1])]
Next, we will randomly insert NAN values into various locations:
# Insert NAN values:
for row, col in random.sample(ij, int(round(.1*len(ij)))):
df.iat[row, col] = np.nan
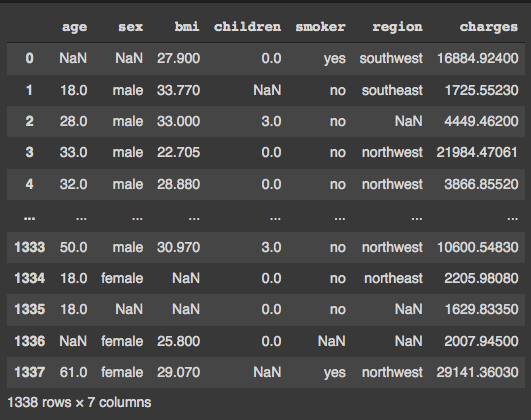
If we check our dataframe once more, we should see approximately 10% of entries as NAN:

To validate the presence of NAN values across the entire dataset, we can execute the following command:
# Check NAN in data frame:
print(df.isnull().values.any(), df.isnull().sum().sum())
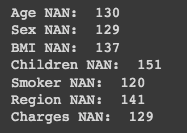
To assess NAN values in specific columns, we can check each relevant column with these commands:
print('Age NAN: ', df['age'].isnull().sum())
print('Sex NAN: ', df['sex'].isnull().sum())
print('BMI NAN: ', df['bmi'].isnull().sum())
print('Children NAN: ', df['children'].isnull().sum())
print('Smoker NAN: ', df['smoker'].isnull().sum())
print('Region NAN: ', df['region'].isnull().sum())
print('Charges NAN: ', df['charges'].isnull().sum())

Now that we have introduced NAN values, we can begin the process of replacing them with suitable alternatives.
Using a Constant Value
One of the most straightforward methods for imputing missing values is to utilize a constant value based on the analyst's understanding of the problem. For instance, to replace all NAN values in the 'children' column with 0, you can use the following code:
# Fill NAN with 0 in children column using pandas:
df['children'] = df['children'].fillna(0)
Alternatively, using numpy:
# Fill NAN with 0 in children column using numpy:
df['children'] = df['children'].replace(np.nan, 0)
After executing the above code, you can verify the changes in the 'children' column:
Imputing with Mean or Mode
The next technique involves using the mean for numerical variables or the mode for categorical variables. Here, we will address missing values for the 'bmi' (numerical) and 'region' (categorical) columns.
To start, compute the mean for the 'bmi' column:
# Get mean for column bmi:
print('Mean BMI is: ', df["bmi"].mean())

Now, replace the NAN values in the 'bmi' column accordingly:
# Replace NAN values with mean:
df['bmi'] = df['bmi'].fillna(30.62)
print('BMI NAN: ', df['bmi'].isnull().sum())

Next, to handle missing values for categorical variables, determine the mode:
# Get mode for column region:
print('Mode region is: ', df["region"].mode())

Then, fill the NAN values in the 'region' column:
# Replace NAN values with mode:
df['region'] = df['region'].fillna('southeast')
print('Region NAN: ', df['region'].isnull().sum())

Random Value Imputation
Another approach is to generate random values based on the observed distribution to replace NAN entries. This method requires careful consideration of the distribution's nature (normal vs. non-normal).
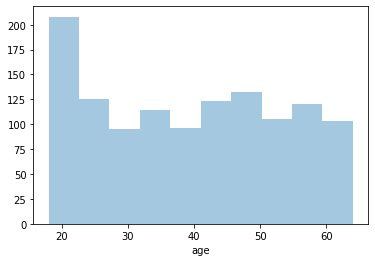
To determine if the 'age' variable follows a normal distribution, we can visualize it:
import seaborn as sns
# Build and display histogram:
sns.histplot(data=df["age"], kde=False)

Observing the histogram, we can see that the data does not follow a normal distribution.
Non-Normal Distribution:
Since the distribution is non-normal, we can generate random values between the minimum and maximum observed values. First, we check the minimum and maximum values:
# Get maximum and minimum values:
print('Min age: ', df["age"].min())
print('Max age: ', df["age"].max())
Next, we define a function to generate values between 18 and 64 and replace the NAN entries:
# Create a function to generate random values and replace NAN:
def fill_missing(value):
if np.isnan(value):
value = np.random.randint(18, 64)return value
Now, we can apply this function to the 'age' column:
# Replace NAN values with random generated values:
df['age'] = df['age'].apply(fill_missing)
print('Age NAN: ', df['age'].isnull().sum())

Normal Distribution:
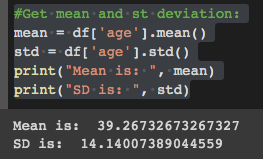
For normally distributed data, we need to exercise caution when generating random values to avoid skewing the distribution. First, we compute the mean and standard deviation:
# Get mean and standard deviation:
mean = df['age'].mean()
std = df['age'].std()

Next, we define a function to generate values based on a normal distribution:
# Create a function to generate random values and replace NAN:
def fill_missing_normal(value):
if np.isnan(value):
value = np.random.normal(mean, std, 1)return value
Finally, we apply this function to the 'age' column:
# Replace NAN values with random generated values:
df['age'] = df['age'].apply(fill_missing_normal)
print('Age NAN: ', df['age'].isnull().sum())
Linear Regression for Continuous Variables
The last method involves utilizing linear regression to predict missing values for a continuous variable, specifically the 'charges' column. Initially, we need to remove any rows with NAN values, as linear regression models do not accept such entries.
# Drop NAN:
df_lm = df.dropna()
Next, we can create a Linear Regression model:
from sklearn.linear_model import LinearRegression
# Define X and y, dropping non-numerical variables:
X = df_lm.drop(['charges', 'sex', 'region', 'smoker'], axis=1)
y = df_lm['charges']
# Fit the model:
lm = LinearRegression().fit(X, y)
Now, similar to previous sections, we create a function to replace missing values:
# Define function:
def fill_missing_lm(value):
if np.isnan(value):
value = lm.predict()return value
Finally, apply the function to the dataframe:
# Replace NAN values with generated values from linear model:
df['charges'] = df['charges'].apply(fill_missing_normal)
print('Charges NAN: ', df['charges'].isnull().sum())

The video "Dealing with Missing Data in R" provides additional insights into handling missing values in datasets, showcasing practical examples and techniques.
The video "18. Missing Data" offers a comprehensive overview of various strategies for addressing missing data in your analysis.
Thank you for reading! I welcome any suggestions for additional techniques, and don’t forget to subscribe for notifications on future publications. If you enjoyed this article, please follow me to stay updated on new releases. Thank you!